Wahlergebnisse
Wahlkartenantrag
EU Wahl 2024

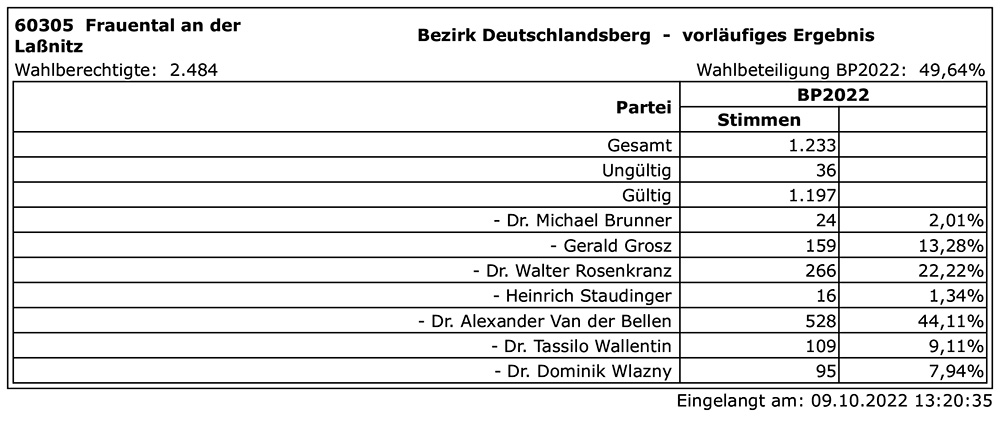
BP-Wahl 2022
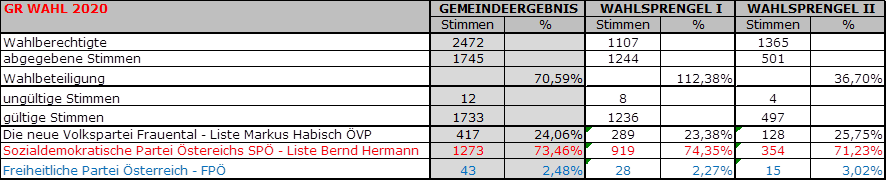
Gemeinderatswahl 2020
LT-Wahl 2019 am 24.11.2019
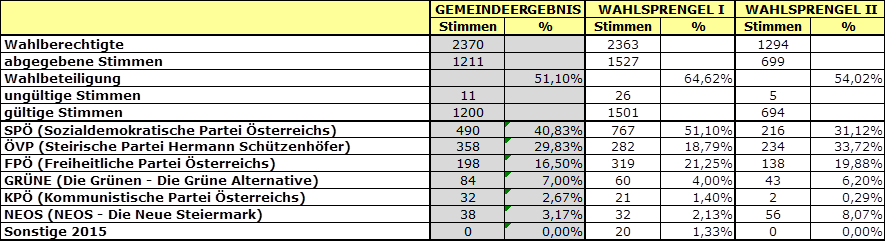
NR-WAHL 2019 am 29.09.2019
EU-WAHL 2019 am 26.05.2019
| GEMEINDEERGEBNIS | WAHLSPRENGEL I | WAHLSPRENGEL II | ||||
| Stimmen | % | Stimmen | % | Stimmen | % | |
| Wahlberechtigte | 2375 | 1078 | 1297 | |||
| abgegebene Stimmen | 1122 | 518 | 604 | |||
| Wahlbeteiligung | 47,24% | 48,05% | 46,57% | |||
| ungültige Stimmen | 16 | 6 | 10 | |||
| gültige Stimmen | 1106 | 512 | 594 | |||
| ÖVP (Österreichische Volkspartei) | 351 | 31,74% | 166 | 32,42% | 185 | 31,14% |
| SPÖ (Sozialdemokratische Partei Österreichs | 370 | 33,45% | 179 | 34,96% | 191 | 32,15% |
| FPÖ (Freiheitliche Partei Österreichs - Die Freiheitlichen) | 217 | 19,62% | 90 | 17,58% | 127 | 21,38% |
| GRÜNE (Die Grünen - Grüne Alternative) | 87 | 7,87% | 38 | 7,42% | 49 | 8,25% |
| NEOS (NEOS Das neue Europa) | 68 | 6,15% | 33 | 6,45% | 35 | 5,89% |
| KPÖ (KPÖ Plus - Europa Left, offene Liste) | 4 | 0,36% | 1 | 0,20% | 3 | 0,51% |
| EUROPA (EUROPA Jetzt - Initiative Johannes Vogenhuber) | 9 | 0,81% | 5 | 0,98% | 4 | 0,67% |
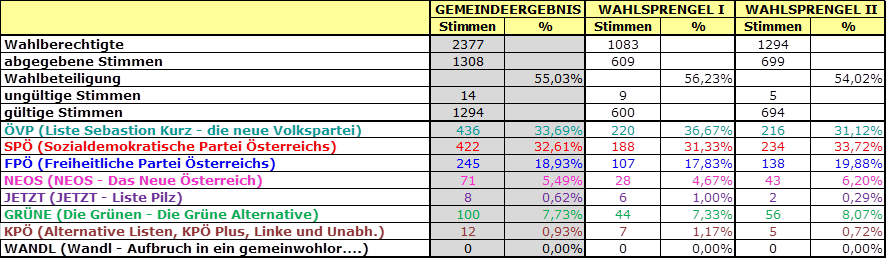
NATIONALRATSWAHL am 15.10.2017
| GEMEINDEERGEBNIS | WAHLSPRENGEL I | WAHLSPRENGEL II | ||||
| Stimmen | % | Stimmen | % | Stimmen | % | |
| Wahlberechtigte | 2384 | 1080 | 1304 | |||
| abgegebene Stimmen | 1540 | 707 | 833 | |||
| Wahlbeteiligung | 64,60% | 65,46% | 63,88% | |||
| ungültige Stimmen | 28 | 18 | 10 | |||
| gültige Stimmen | 1512 | 689 | 823 | |||
| SPÖ | 567 | 37,50% | 243 | 35,27% | 324 | 39,37% |
| ÖVP | 383 | 25,33% | 176 | 25,54% | 207 | 25,15% |
| FPÖ | 428 | 28,31% | 199 | 28,88% | 229 | 27,83% |
| GRÜNE | 17 | 1,12% | 3 | 0,44% | 14 | 1,70% |
| NEOS | 65 | 4,30% | 39 | 5,66% | 26 | 3,16% |
| KPÖ | 6 | 0,40% | 2 | 0,29% | 4 | 0,49% |
| GILT | 3 | 0,20% | 2 | 0,29% | 1 | 0,12% |
| PILZ | 39 | 2,58% | 22 | 3,19% | 17 | 2,07% |
| FLÖ | 2 | 0,13% | 1 | 0,15% | 1 | 0,12% |
| WEIßE | 2 | 0,13% | 2 | 0,29% | 0 | 0,00% |
BP-Wahl 2016
Wahl der Bundespräsidentin oder des Bundespräsidenten - Wiederholung 2. WAHLGANGWahl der Bundespräsidentin oder des Bundespräsidenten - 2. WAHLGANGWahl der Bundespräsidentin oder des Bundespräsidenten
LANDTAGSWAHL 2015
| GEMEINDEERGEBNIS | WAHLSPRENGEL I | WAHLSPRENGEL II | ||||
| Stimmen | % | Stimmen | % | Stimmen | % | |
| Wahlberechtigte | 2363 | 1078 | 1285 | |||
| abgegebene Stimmen | 1527 | 884 | 643 | |||
| Wahlbeteiligung | 64,62% | 82,00% | 50,04% | |||
| ungültige Stimmen | 26 | 19 | 7 | |||
| gültige Stimmen | 1501 | 865 | 636 | |||
| SPÖ (Sozialdemokratische Partei Österreichs mit Franz Voves) | 767 | 51,10% | 457 | 52,83% | 310 | 48,74% |
| ÖVP (Österreichische Volkspartei) | 282 | 18,79% | 157 | 18,15% | 125 | 19,65% |
| FPÖ (Freiheitliche Partei Österreichs) | 319 | 21,25% | 169 | 19,54% | 150 | 23,58% |
| GRÜNE (Die Grünen - Die grüne Alternative) | 60 | 4,00% | 36 | 4,16% | 24 | 3,77% |
| KPÖ (Kommunistische Partei Österreichs) | 21 | 1,40% | 14 | 1,62% | 7 | 1,10% |
| FRANK (Team Frank Stronach) | 20 | 1,33% | 11 | 1,27% | 9 | 1,42% |
| NEOS (Neos des neue Österreich und Liberales Forum) | 32 | 2,13% | 21 | 2,43% | 11 | 1,73% |
Gemeinderatswahl 2015 |
|||
| 2015 | Vergleich mit 2010 | Differenz | |
| Wahlberechtigte | 2450 | 2472 | |
| Abgegebene Stimmen | 1886 | 1983 | |
| Wahlbeteiligung | 76,98% | 80,22% | |
| ungültige Stimmen | 35 | 46 | |
| Gültige Stimmen | 1851 | 1937 | |
| SPÖ | 1342 72,50% | 1410 72,79% | -0,29% |
| ÖVP | 409 22,10% | 527 27,21% | -5,11% |
| FPÖ | 100 5,40% | 5,40% | |
| Gemeinderatssitze | SPÖ 12 |
| ÖVP 3 |
Nationalratswahl 2013 |
||
|
|
Stimmen |
Prozent |
|
SPÖ |
642 |
42,10% |
|
ÖVP |
206 |
13,51% |
|
FPÖ |
322 |
21,11% |
|
BZÖ |
52 |
3,41% |
|
GRÜNE |
105 |
6,89% |
|
FRANK |
126 |
8,26% |
|
NEOS |
47 |
3,08% |
|
KPÖ |
14 |
0,92% |
|
PIRAT |
9 |
0,59% |
|
CPÖ |
2 |
0,13% |
Gemeinderatswahl 2010 |
||
|
|
Stimmen |
Prozent |
|
SPÖ |
1410 |
72,79% |
|
ÖVP |
527 |
27,21% |
Das aktuelle Wahlergebnis der Gemeinderatswahl 2010
EU-WAHL 2009 |
||
|
|
Stimmen |
Prozent |
|
SPÖ |
391 |
41,55% |
|
ÖVP |
203 |
21,57% |
|
MARTIN |
161 |
17,11% |
|
GRÜNE |
38 |
4,04% |
|
FPÖ |
94 |
9,99% |
|
KPÖ |
5 |
0,53% |
|
JuLis |
1 |
0,11% |
|
BZÖ |
48 |
5,10% |
Nationalratswahl 2008 |
||
|
|
Stimmen |
Prozent |
|
SPÖ |
461 |
47,82% |
|
ÖVP |
168 |
17,43% |
|
GRÜNE |
61 |
6,33% |
|
FPÖ |
134 |
13,90% |
|
BZÖ |
119 |
12,34% |
|
KPÖ |
4 |
0,41% |
| SONSTIGE |
17
|
1,76%
|
Das aktuelle Wahlergebnis der Nationalratswahl 2008
Nationalratswahl 2006 |
||
|
|
Stimmen |
Prozent |
|
SPÖ |
572 |
55,64% |
|
ÖVP |
269 |
26,17% |
|
GRÜNE |
45 |
4,38% |
|
FPÖ |
72 |
7,00% |
|
BZÖ |
40 |
3,89% |
|
KPÖ |
14 |
1,36% |
| SONSTIGE |
16
|
1,56%
|
Gemeinderatswahl 2005 |
||
|
|
Stimmen |
Prozent |
|
SPÖ |
1248 |
67,24% |
|
ÖVP |
606 |
32,76% |
Landtagswahl 2005 |
||
|
|
Stimmen |
Prozent |
|
ÖVP |
533 |
29,64% |
|
SPÖ |
1053 |
58,57% |
|
FPÖ |
36 |
2,00% |
|
GRÜNE |
44 |
2,45% |
|
KPÖ |
84 |
4,67% |
|
LH |
14 |
0,78% |
| BZÖ |
34
|
1,99%
|
| LIF |
0
|
0,00%
|
Europawahl 2004 |
||
|
|
Stimmen |
Prozent |
|
SPÖ |
548 |
55,35% |
|
ÖVP |
238 |
24,04% |
|
FPÖ |
48 |
4,85% |
|
GRÜNE |
62 |
6,26% |
|
LINKE |
4 |
0,40% |
|
MARTIN |
90 |
9,09% |
Nationalratswahl 2002 |
||
|
|
Stimmen |
Prozent |
|
SPÖ |
984 |
52,73 % |
|
FPÖ |
172 |
9,22 % |
|
ÖVP |
606 |
32,48 % |
|
GRÜNE |
90 |
4,82 % |
|
KPÖ |
6 |
0,32 % |
|
LIF |
8 |
0,43 % |
Gemeinderatswahl 2000 |
||
|
|
Stimmen |
Prozent |
|
ÖVP |
493 |
26,49 % |
|
SPÖ |
1256 |
67,49 % |
|
FPÖ |
112 |
6,02 % |
Landtagswahl 2000 |
||
|
|
Stimmen |
Prozent |
|
ÖVP |
677 |
38,69 % |
|
SPÖ |
806 |
46,06 % |
|
FPÖ |
189 |
10,80 % |
|
GRÜNE |
64 |
3,66 % |
|
LIF |
9 |
0,51 % |
|
KPÖ |
5 |
0,29 % |